Our goals
IndoorCO2Map is a citizen science project which ultimately has one goal: to improve indoor air quality across the world. The benefits of better indoor air are many. To name a few: it slows the spread of infectious diseases, improves wellbeing, and helps people think more clearly.
We spend almost all of our lives indoors, most of us around 90% of the time. Much of that time is spent breathing air in buildings we share with other people and that air often has dubious quality. However, we rarely think about it as most indoor air pollution is neither seen nor smelt.
Air that other people have already breathed can carry microbes. In a badly ventilated room, the risk of infectious persons passing an illness to someone sitting many metres away strongly increases, and as pathogens can linger in the air for many minutes the risk does not end the moment they leave. Stale air also makes people tired, gives them headaches and makes it harder to think clearly.
Why Measure Indoor CO₂?
We measure CO₂ because it serves as a good proxy for the amount of rebreathed air in an indoor space. This matters because exhalations carry not only CO₂ but also viruses and bacteria. In a badly ventilated room, exhaled air builds up and the CO₂ level rises with it, so a higher reading means more of the air has already been breathed by other people. If anyone in the room is infectious, more rebreathed air means a higher risk of infection for everyone else.
CO₂ levels are measured in parts per million (ppm), meaning how many parts of the air are CO₂. Outdoor air currently contains around 420 ppm of CO₂, although levels vary slightly with location, season and nearby sources such as traffic.
In an indoor space, anything above the local outdoor level comes from indoor sources, the main one being human respiration in most circumstances. Exhaled breath contains around 40,000 ppm of CO₂, so every 400 ppm above the outdoor level means roughly 1% of the room air has already been breathed out by someone.
At 2500 ppm, a value often reached in schools and other badly ventilated places, a little more than 5% of the room air has already been in someone else's lungs.
People aren’t the only source, though, because gas or wood stoves, fireplaces, candles and dry ice also emit CO₂ and raise the level in rooms where they’re used.
Normal breathing generally releases fewer infectious particles than talking. Shouting and singing release far more. So 2500 ppm in a silent cinema is not the same as 2500 ppm during a choir rehearsal or in a loud bar. CO₂ readings are most meaningfully compared between settings with similar activities.
CO₂ data has clear limits. It tells us about rebreathed air, but says nothing about filtration, which can remove particles without altering CO₂ levels. It also doesn't directly measure other indoor or outdoor pollutants. Fortunately, good ventilation dilutes both rebreathed air and many airborne pollutants, so CO₂ levels can serve as a rough indicator of how well indoor air is being diluted.
While CO₂ measurements don't tell the whole story of indoor air quality, they make ventilation conditions visible. By collecting and comparing readings across public spaces, we can assess the current state, identify where ventilation may be inadequate, and build an evidence base for improvement.
Feasibility of Good Indoor Air Quality
Historically, indoor air has hardly been measured at all. Existing research focuses on schools, homes and hospitals. Even then, studies are isolated and sparse. Before the inception of IndoorCO2Map.com, there was very little data for places that people frequent every day: shops, cafés, gyms, waiting rooms, offices and public transit. As of November 2026, more than 32,500 measurements have been submitted since the project’s inception in 2024.
These measurements already show how wide the range of CO₂ levels in different locations is. With some exceptions, fast food restaurants, large hardware stores and clothing shops tend to have mostly low CO₂ levels, while doctor's offices and pubs often have high CO₂ levels. But every category has at least some locations with great air quality.
Air quality can vary even within the same building type. Even virtually identical buildings, such as different supermarkets from the same chain built in exactly the same way, can have totally different CO₂ levels. The same place can also differ from one visit to the next: some locations have good air every time they’re measured, some never do and some only sometimes.
This suggests that in these cases the difference is most likely due to how the ventilation systems are operated. Improving the air there needs no retrofit and no new system, only running the existing ventilation system differently. That can increase energy demand slightly. But the locations that already ventilate well are still in business, so the extra energy cannot be a deciding factor. A back-of-the-envelope calculation puts it at a few cents per supermarket customer at most.
Helping People Make Informed Choices
Our project aims to give people around the world open access to data that helps them make more informed choices about where they spend their time indoors. You can usually see whether a restaurant is clean or whether a train is crowded or whether a shop is accessible. However, a room can look and smell perfectly normal while being very poorly ventilated.
IndoorCO2Map keeps you informed in two ways. The first is through CO₂ measurements recorded by previous visitors to a location. This gives you an idea of what to expect, and you can add your own measurements, too.
The second is by identifying patterns across multiple measurements. With enough data, we can see which types of places tend to have poor ventilation, which chains appear to manage ventilation well, and how readings vary by season or time of day.
Our data, for example, suggests that doctors’ offices tend to have poor air quality. This is particularly concerning because people visiting a doctor may be infectious, while others in the same space may be especially vulnerable to infection.
That gives useful rules of thumb even for all the locations that have never been measured.
It’s important to note that CO₂ measurements, and the map itself, are not safety ratings. Readings represent singular snapshots, and both CO₂ and air quality fluctuate over time. A café with a lower reading of 600 ppm on a weekday morning may rise to 1800 ppm on a busy afternoon. CO₂ is also only one part of indoor air quality.
But incomplete information is not the same as useless information. Let’s say you’re thinking of seeing a show at a nearby theatre. While a single reading of low CO₂ from three weeks ago won’t tell you about the air quality on the night you arrive, a single reading of high CO₂ (say, 3000 ppm) tells you that the air quality at that location does get bad at least sometimes. Perhaps they don’t have adequate ventilation. From there, you can make an informed decision.
Sharing Open Data
IndoorCO2Map collects data that no institution has yet managed to gather at scale: CO₂ measurements from the everyday public spaces and public transport people use.
Measuring these places through a conventional research project is slow and expensive. Each location needs a sensor, the owner's permission, money for installation and someone to retrieve and maintain the equipment. That is manageable for a study covering a few dozen buildings, but not for hundreds of thousands of everyday locations. Because of these hurdles, research so far has produced a collection of valuable but scattered case studies rather than a broad picture of the indoor air people actually breathe.
Thankfully, IndoorCO2Map is built through crowdsourced measurements. One person can’t map a country, but thousands of people measuring a few places each can.
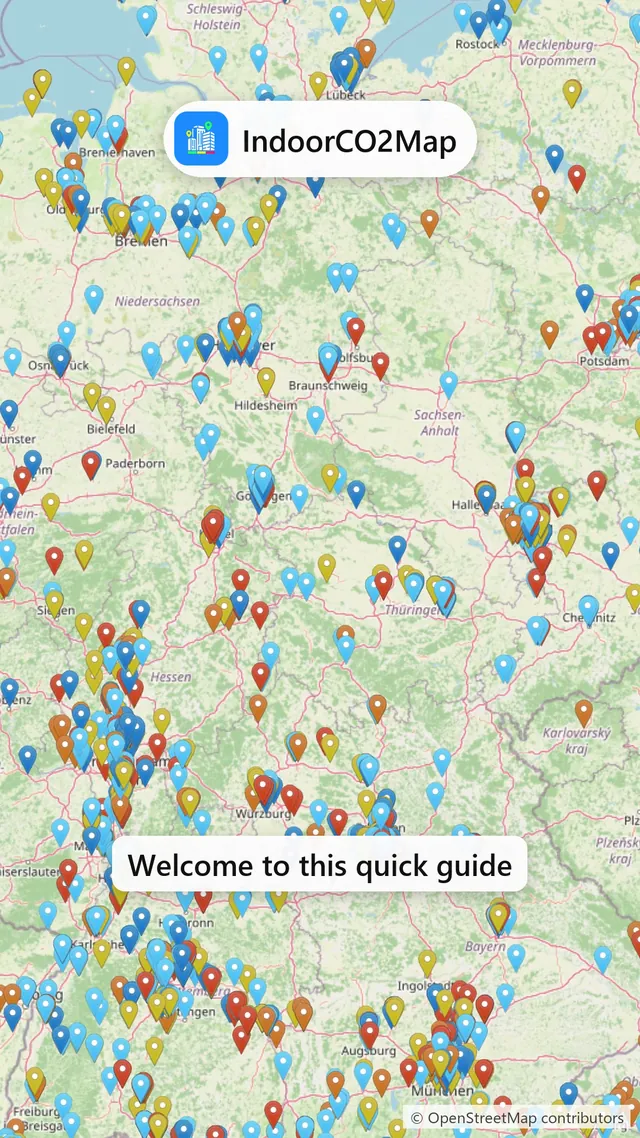
Our map currently has more than 32,500 measurements from over 12,000 locations in 57 countries. Because the approach is decentralised and requires little maintenance, the dataset can grow continuously and at significantly lower cost than multiple conventional research projects.
Building this dataset is not a goal in itself. Its value lies in the insights it makes possible. It can reveal how indoor CO₂ levels vary between countries, building types, seasons, times of day and commercial brands. It can help identify groups of people and types of places that may be disproportionately exposed to poor ventilation, highlight patterns warranting closer investigation, and provide additional data for epidemiological research.
Crowdsourced datasets are not replacements, but rather complements, to controlled studies. Their scale is what enables insights that smaller studies can’t on their own.
IndoorCO2Map’s data is available under a free licence. Researchers can combine the measurements with their own data and methods.
Open data also makes the project itself more useful and more accountable. Other people can reproduce analyses, find errors, challenge assumptions and build tools that IndoorCO2Map would never have the capacity to develop on its own.
By making the data freely available, we allow different people to use it for different purposes: from helping individuals make informed decisions about the spaces they use to supporting scientific research and informing policy.
Estimate The Cost of Good Air
For policy change, it is important to estimate how much it would cost to improve indoor air quality. Our measurements provide a starting point for estimating what would be needed to bring buildings up to a reasonable standard.
By combining the data with information on building types, occupancy, climate, energy use, ventilation technologies and installation costs, we can estimate the investments needed to improve ventilation across the building stock.
Using this data, we could develop a model to calculate capital and running costs by building type and region, along with the effects on energy demand and carbon emissions. It could show which interventions deliver the largest improvements under a limited budget and which sectors should be addressed first. It could also distinguish between buildings that mainly need better operation of existing systems and those that require substantial investment.
The purpose is to make the case for "better indoor air" concrete enough to regulate and budget for, even if initial calculations would be rough estimates.
See the air quality of indoor spaces near you
Take part
Every reading adds to a bigger picture of the air we breathe. It fits around your day rather than interrupting it: start a recording, carry on as normal, and submit it when you're done. Nothing is collected passively: the app only measures while a recording you started is running.