You are what you breathe
We spend the majority of our lives indoors, which makes indoor air quality a significant factor in our health and wellbeing. Yet we rarely give it a second thought: most indoor air pollution can’t be seen or smelt, and the air quality in the shops, cafés, waiting rooms and trains we use every day is almost never measured.
IndoorCO2Map is a global citizen science project that maps air quality in public indoor spaces. Its users collect the data while going about their day as usual, taking a portable CO2 sensor along when they shop, wait at the doctor’s or commute. The measurements reveal how well a space is ventilated and how much of the air has already been breathed out by others, air that can carry viruses and other infectious microbes.
It makes indoor air quality visible to everyone, empowering you to make informed choices and supporting evidence-based health policies to improve the air we breathe indoors.
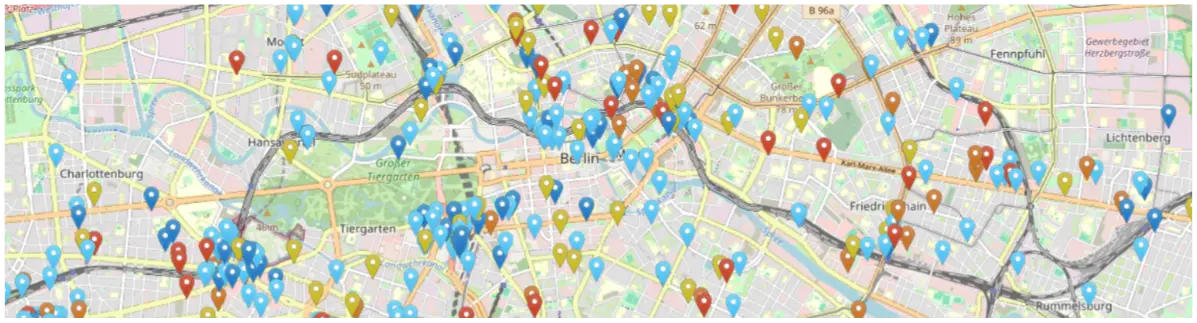
Let's get clean indoor air on the agenda
Much like outdoors, indoor air can be polluted, too. Every day, we spend 90% of our time breathing a cocktail of carbon dioxide, allergens, indoor emissions, biological aerosols (like viruses), and more. In poorly ventilated spaces, this adds up. But how would you know, and what can you do?
On the one hand, indoor environments are often managed at an institutional level. On the other, it's the people who spend time in those spaces that have insight into what the conditions are actually like. Public participation can help policy makers understand what changes need to be prioritised.
By taking part in the IndoorCO2Map project, you can contribute to a bigger, more complete picture of indoor air, and help build evidence of what improvements people need for better air quality and better health.
CO2 levels are a reliable indicator of exhaled air and how well or poorly ventilated a space is. They’re easily measurable and help to tell part of the story of indoor air quality.
Fewer Airborne Infections
Good ventilation and air filtration dilutes infectious particles, making it much less likely for airborne illnesses to spread in shared spaces, lowering our risks of catching them.
Clearer Thinking
Indoor air quality can affect our thinking. Studies show that we have an easier time focusing, thinking and learning in better-ventilated spaces.
Better Sleep
Optimising our home and bedroom air quality with good ventilation and HEPA purifiers has positive impacts on sleep quality and long-term health.
See the air quality of indoor spaces near you
Insights
About three in ten pubs and bars average above 1,400 ppm, not a single DIY store does
Share of measured places at each CO2 level of the GO IAQS Score, based on the average of each place’s recordings. Even in doctors’ practices, 13% average above 1,400 ppm and only 39% stay at or below 800 ppm. Yet every type of place also has places with good air, which shows that good air is achievable everywhere.
- Good: up to 800 ppm
- Moderate: 801 to 1,400 ppm
- Unhealthy: above 1,400 ppm
Trains have the worst air in public transport, trams the best
62% of tram and light rail journeys stay at or below 800 ppm. On regional trains, 13% of journeys average above 1,400 ppm, more than on any other mode.
- Good: up to 800 ppm
- Moderate: 801 to 1,400 ppm
- Unhealthy: above 1,400 ppm
Where the data comes from: Vienna, Leipzig and Berlin lead
Building recordings per region. 277 regions have at least one recording, 6 have more than 1,000, including California.
About these numbers
The charts are based on the open data export of 4 November 2026: 25,585 recordings in buildings and 6,947 journeys on public transport. It is an exploratory first look: about 70% of the data comes from Germany and Austria, and volunteers choose where they measure. CO2 levels follow the GO IAQS Score by GO AQS: good up to 800 ppm, moderate from 801 to 1,400 ppm and unhealthy above 1,400 ppm.
About the project
IndoorCO2Map.com is an open source and open data project, built by Aurel Wünsch in his free time with input from the user community. The project itself is really the community: anyone measuring indoor air quality wherever they go, and sharing what they find. No single person or institution could collect data at this scale. Together, we can. The map is already the largest dataset of its kind.
Our goals
IndoorCO2Map ultimately has one goal: to improve indoor air quality around the world. To get there, it aims to demonstrate that good indoor air is feasible in every type of place, help people make informed choices about where they spend their time, share all of its data openly for research and policy, and estimate what better indoor air would cost.
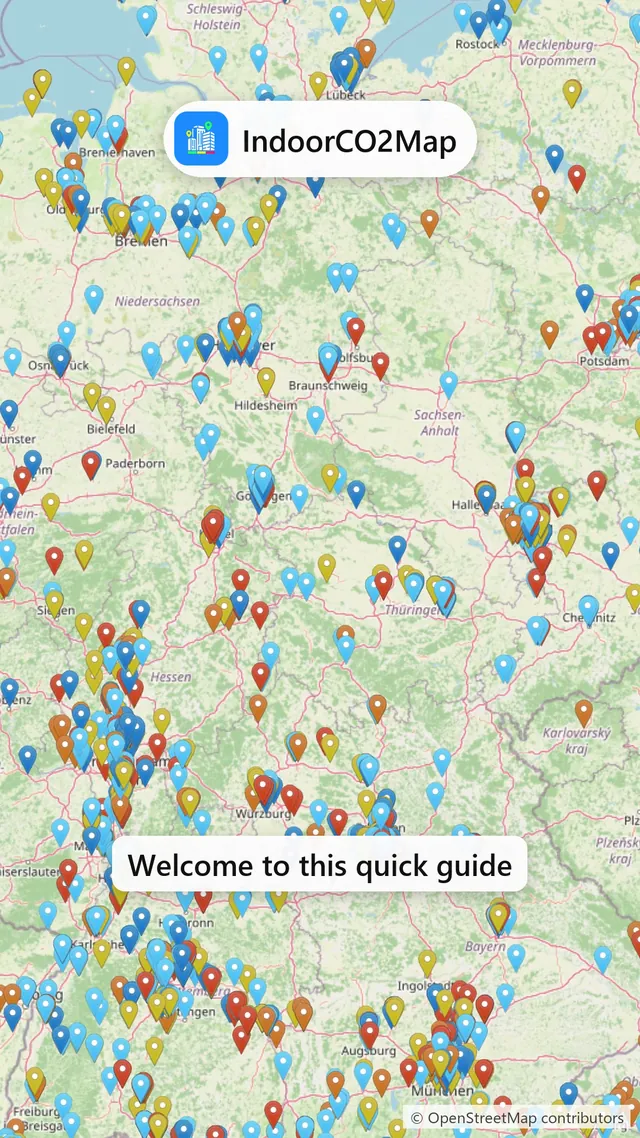
Take part
Every reading adds to a bigger picture of the air we breathe. It fits around your day rather than interrupting it: start a recording, carry on as normal, and submit it when you're done. Nothing is collected passively: the app only measures while a recording you started is running.